Transaction Performance Summary
Analyzing Test Results · Understanding LoadRunner Analysis
LoadRunner Controller User's Guide (Windows)
Chapter 13, page 214
In
4
Select the transactions that you want to include in the graph. Use the
CTRL
key to
select multiple transactions.
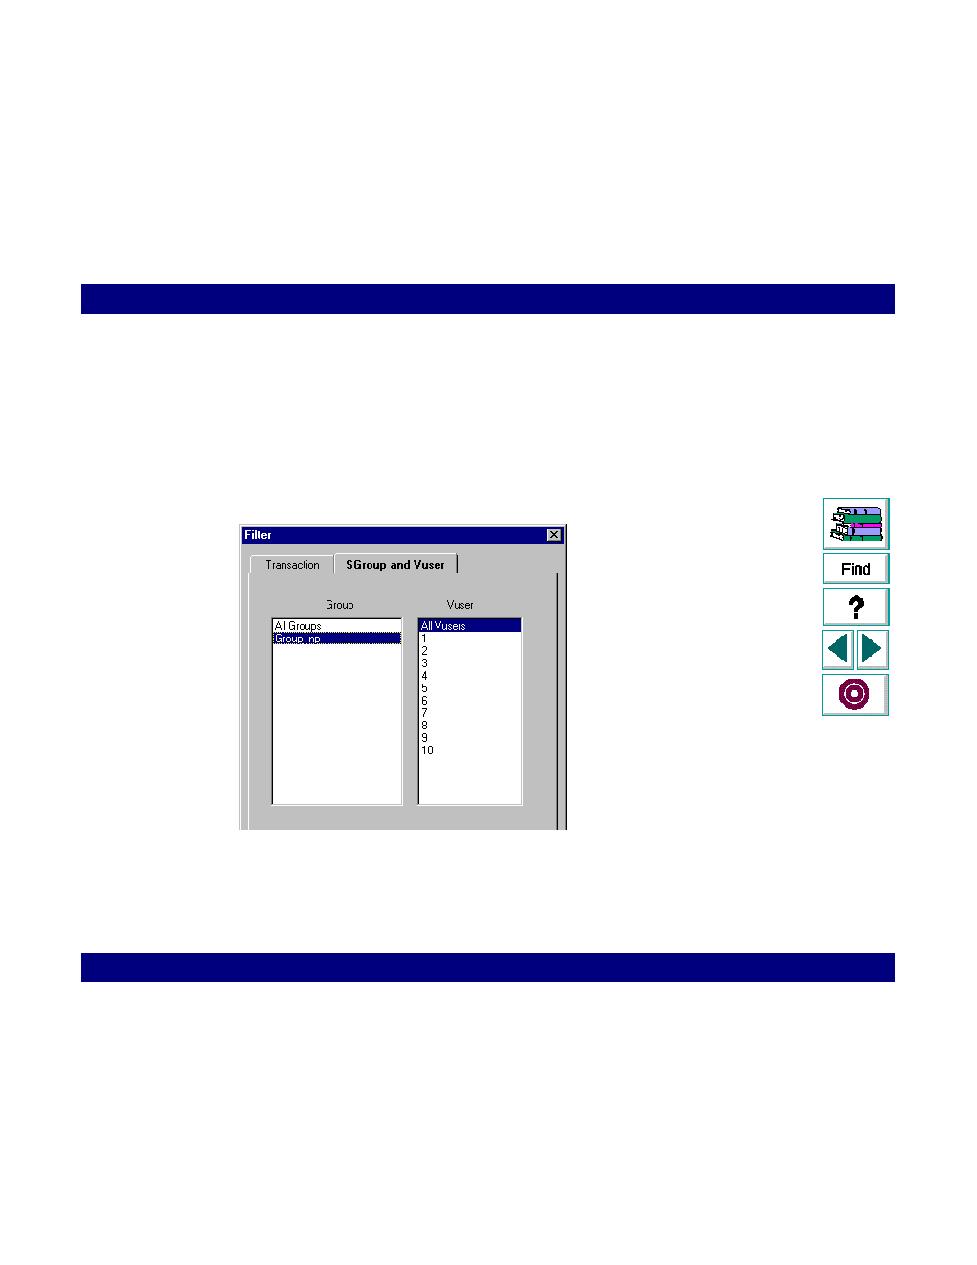
For graphs that show individual Vuser performance, such as Transaction
Performance Summary by Vuser graph, you can filter the graphs to display
information for a single Vuser. Click the Group and Vuser tab and select the Vuser
that you want to display.
5
Click OK. The Filter dialog box closes. The graph appears and displays the
selected transactions or Vusers.