query transaction
Analyzing Test Results · Analyzing Scenario Activity
LoadRunner Controller User's Guide (Windows)
Chapter 14, page 234
In
On the Rendezvous graph, the
x-axis
indicates the number of seconds that elapsed
since the start of the scenario run. The
y-axis
indicates the number of Vusers that
were released from the rendezvous. If you set a rendezvous for 60 Vusers, and the
graph indicates that only 20 were released, you can see that the rendezvous ended
when the timeout expired because all of the Vusers did not arrive.
In the above Rendezvous graph, the first
query
rendezvous takes place during the
312th second of the scenario, and 60 Vusers were released. By comparing these
results to the Transaction Performance graph, you see that the peak time for the
query transaction occurred under the load of sixty Vusers, with a response time of
20 seconds.
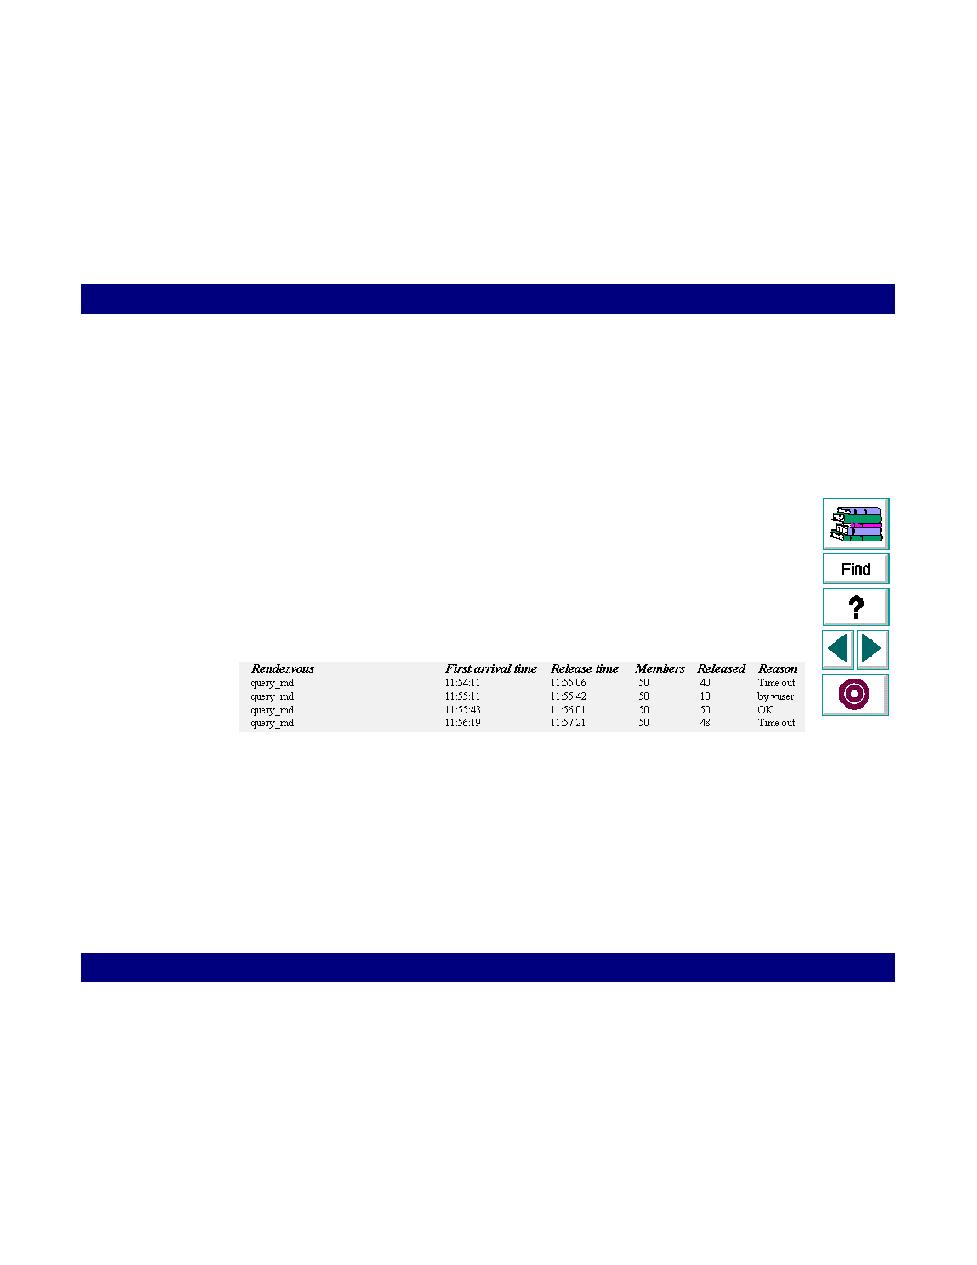
The Rendezvous report provides additional information about the rendezvous.
In the above report, the rendezvous policy was set to All Arrived, requiring all 50
Vusers to arrive at the rendezvous point. In the first rendezvous, 40 Vusers were
released after the timeout period while 10 Vusers were manually released by the
operator. In the next rendezvous, all 50 Vusers arrived. In the last rendezvous, two
Vusers never arrived, causing the others to reach the timeout.