Performance Under Load Graph
Analyzing Test Results · Analyzing Scenario Performance
LoadRunner Controller User's Guide (Windows)
Chapter 15, page 247
Performance Under Load Graph
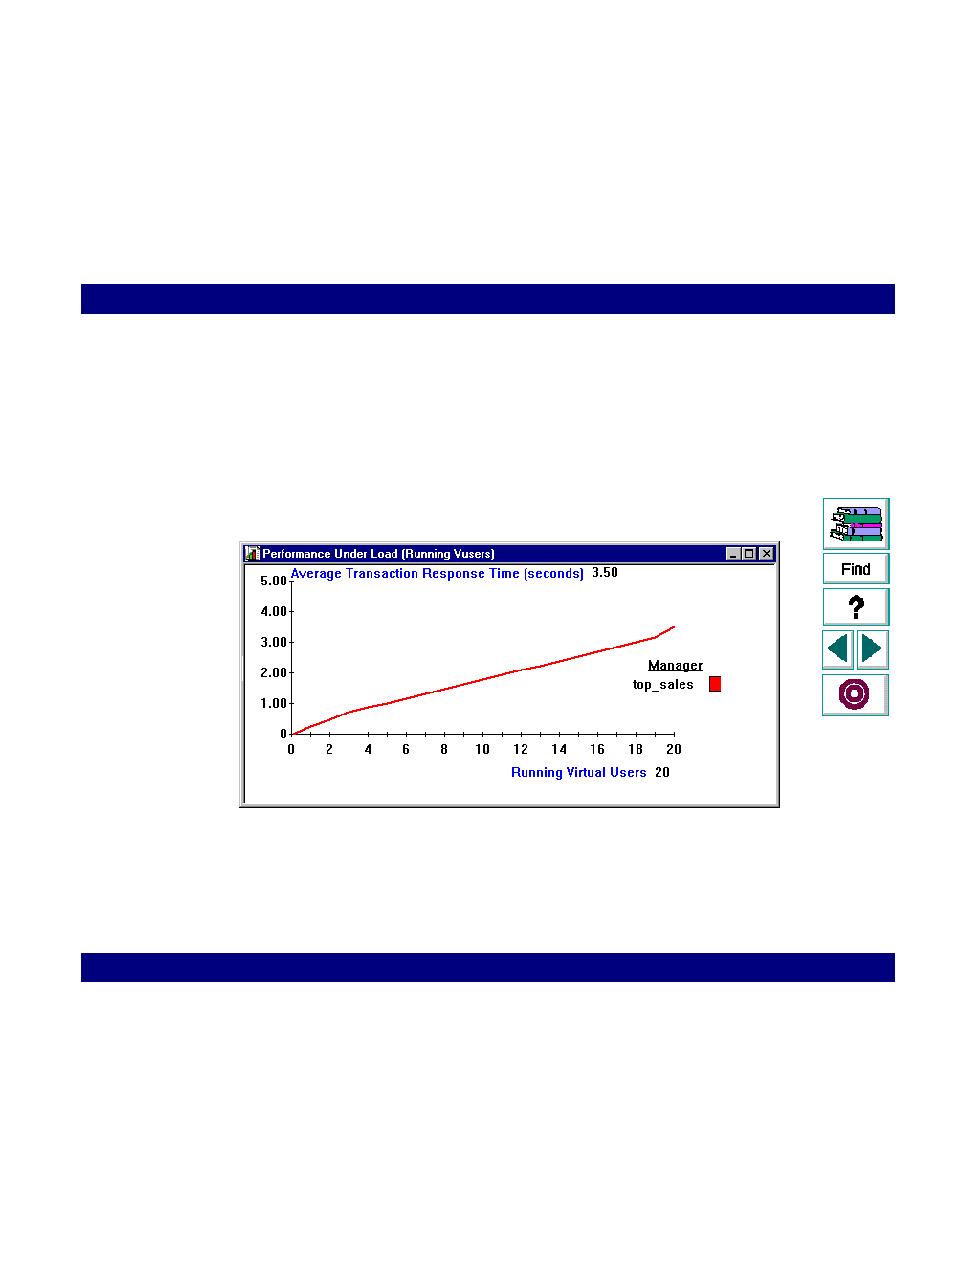
The Performance Under Load graph indicates transaction times relative to the
number of Vusers running at any given point during the scenario. This graph helps
you view the general impact of Vuser load on performance time and is most useful
when analyzing a scenario with a gradual load. You can create a gradual load
using the scheduling options in the Vuser information box.
The
x-axis
indicates the number of running Vusers, and the
y-axis
indicates
average transaction time in seconds. In the above graph, the execution time for the
top_sales transaction increases with the number of running Vusers. For twenty
running Vusers, the response time for the transaction was 3.5 seconds.