Transaction Distribution Graph
Analyzing Test Results · Analyzing Scenario Performance
LoadRunner Controller User's Guide (Windows)
Chapter 15, page 259
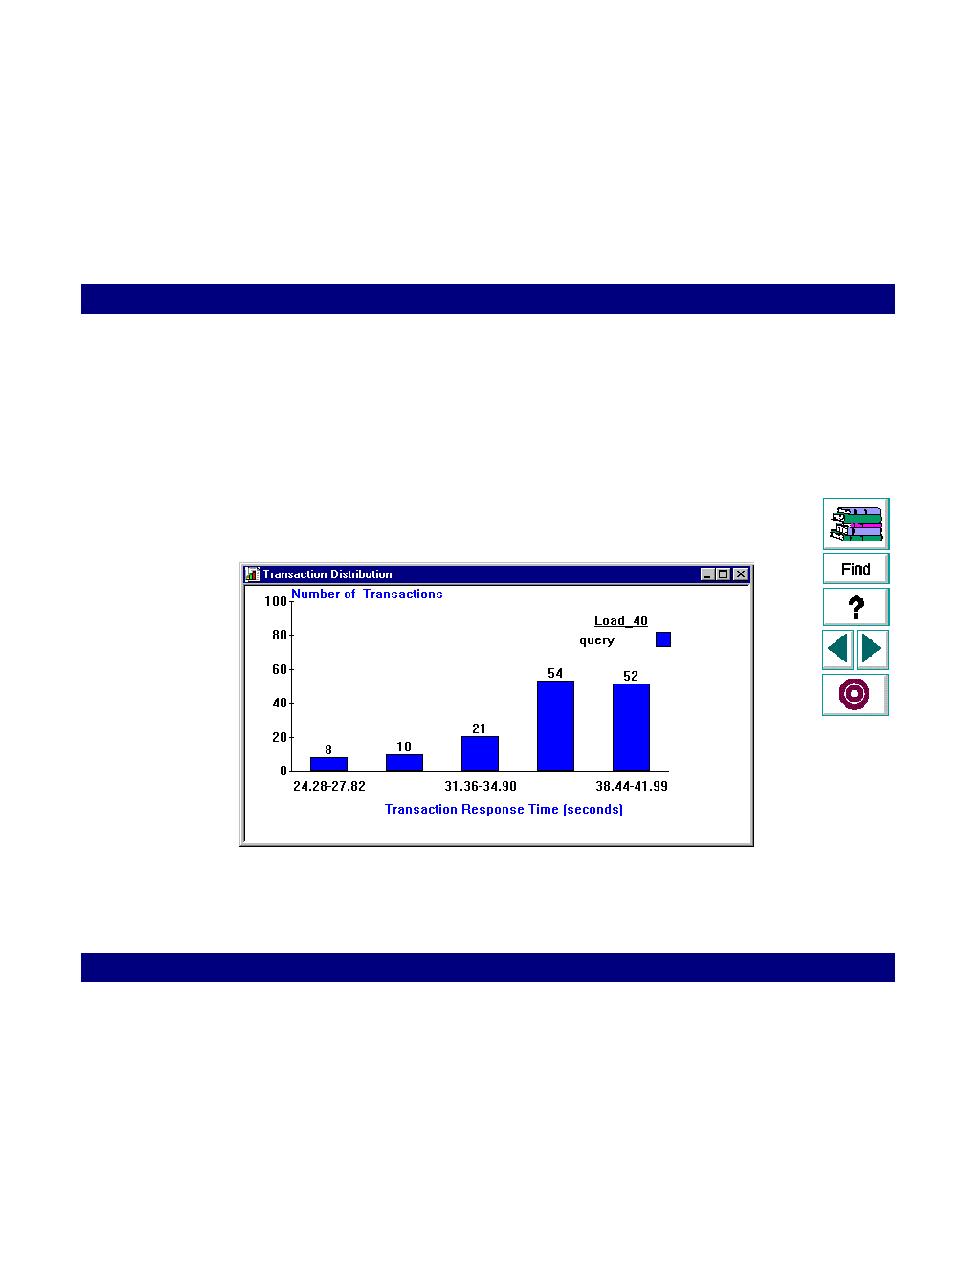
Transaction Distribution Graph
The Transaction Distribution graph displays the distribution of the time taken to
perform a transaction. The transaction response times are divided into five
bars
.
Each bar shows how many times the transaction was completed within a given
time range. If you compare it to the Transaction Performance Summary graph, you
can see how the average performance was calculated. Note that this graph only
displays information for a single transaction.