Determining the Problem Segment
Monitoring · Network Monitoring
LoadRunner Controller User's Guide (Windows)
Chapter 20, page 326
In
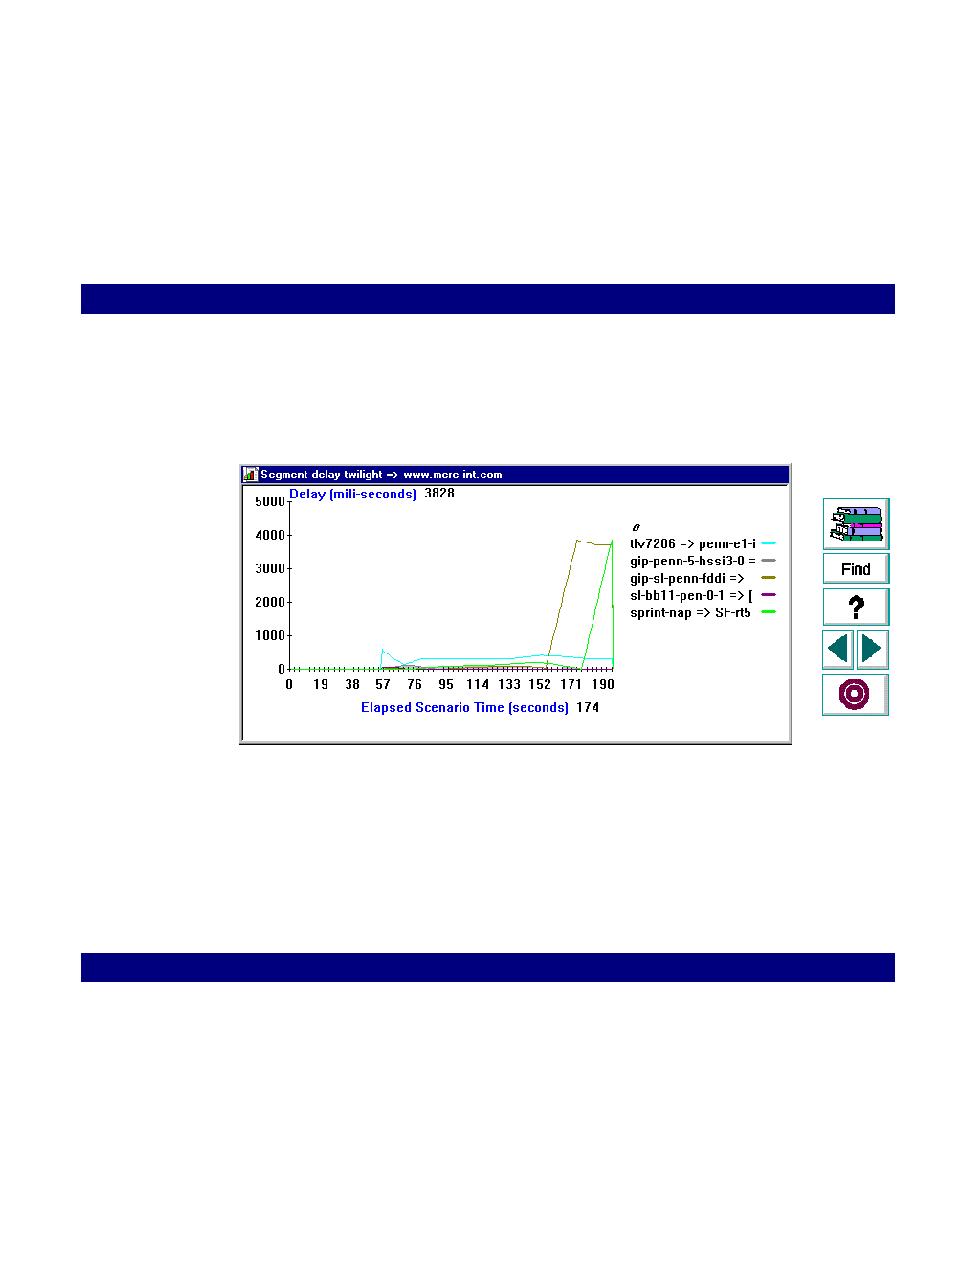
Determining the Problem Segment
When you perform Network monitoring, each
node
, or segment, is represented by
a unique color in the graph. The problematic nodes are easily distinguishable.
In the above example, the
gip-sl-penn-fddi
node caused the primary delay. Fixing
or bypassing this node would improve the network performance and overall
response time.