Displaying the State Histograms
136
Chapter 5 - Executing Tests
The
Users Inside
column shows the percentage of virtual testers that are currently
executing each portion of the suite. The percentage next to the user group shows the
percentage of total virtual testers that have been assigned to the group and have not
yet exited the suite. The percentage next to the items within a user group shows the
percentage of virtual testers within that group that are executing that item.
For example, if the Sales user group contains 50 percent of the total virtual testers, the
Users Inside
column for that group is 50 percent. If all virtual testers in the Sales group
are executing the Read Record test script, the
Users Inside
column for that test script is
100 percent.
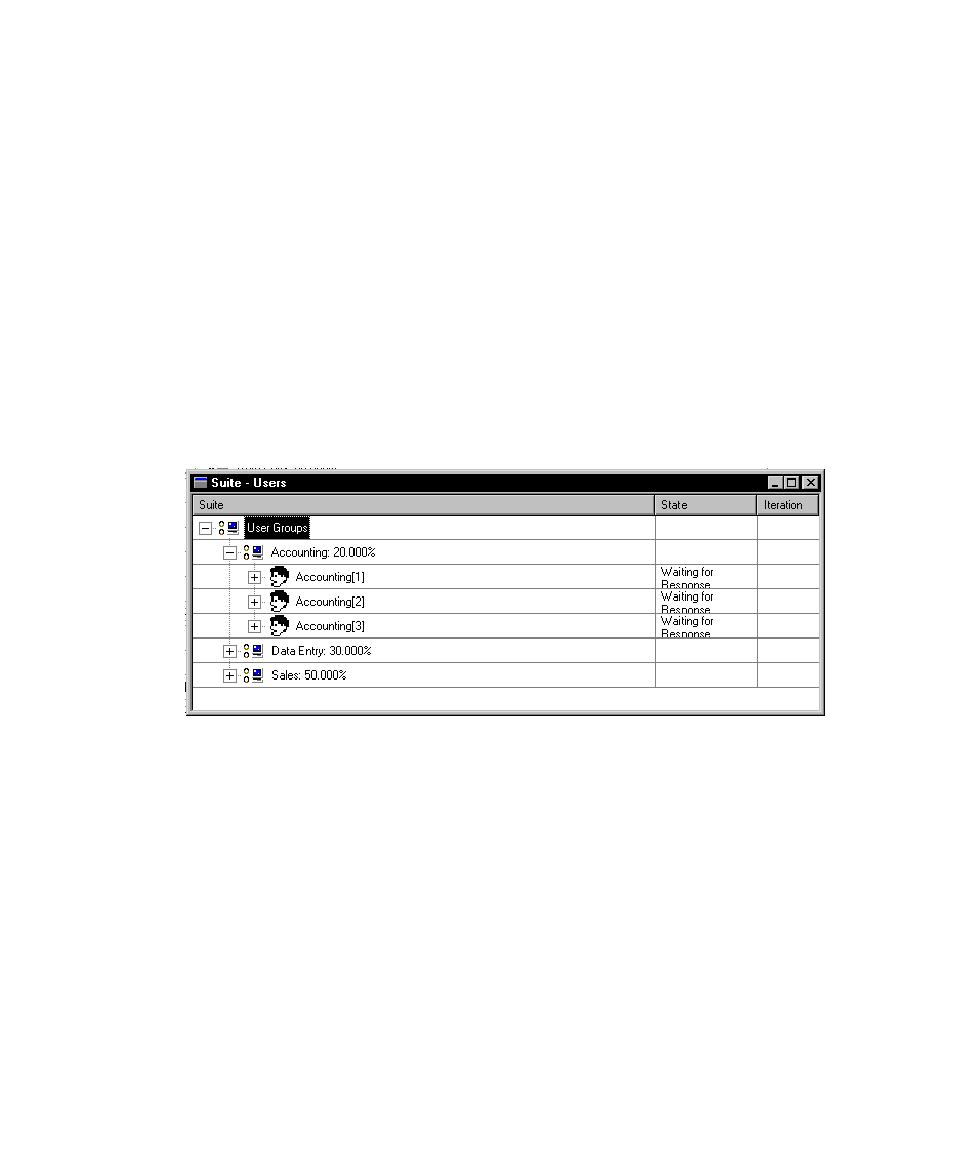
The Suite - Users and Suite - Computers Views
To display the Suite - Users or the Suite - Computers view:
s
During a suite run, click
Monitor > Suite > User
to display a Suite - Users view.
Click
Monitor > Suite > Computers
to display a Suite - Computers view.
For information about each column in this view, see Suite - Users
or Suite - Computers
in
the TestManager Help Index.
Displaying the State Histograms
The state histograms group the virtual testers into various states, such as exiting and
initializing. Use a histogram to display a bar graph of how many virtual testers are in
each state.
To display a state histogram:
s
During a run, click
Monitor > Histogram
, and select the desired histogram.
