Connections per Second Graph
Analyzing Test Results · Web Vuser Graphs
LoadRunner Controller User's Guide (Windows)
Chapter 17, page 279
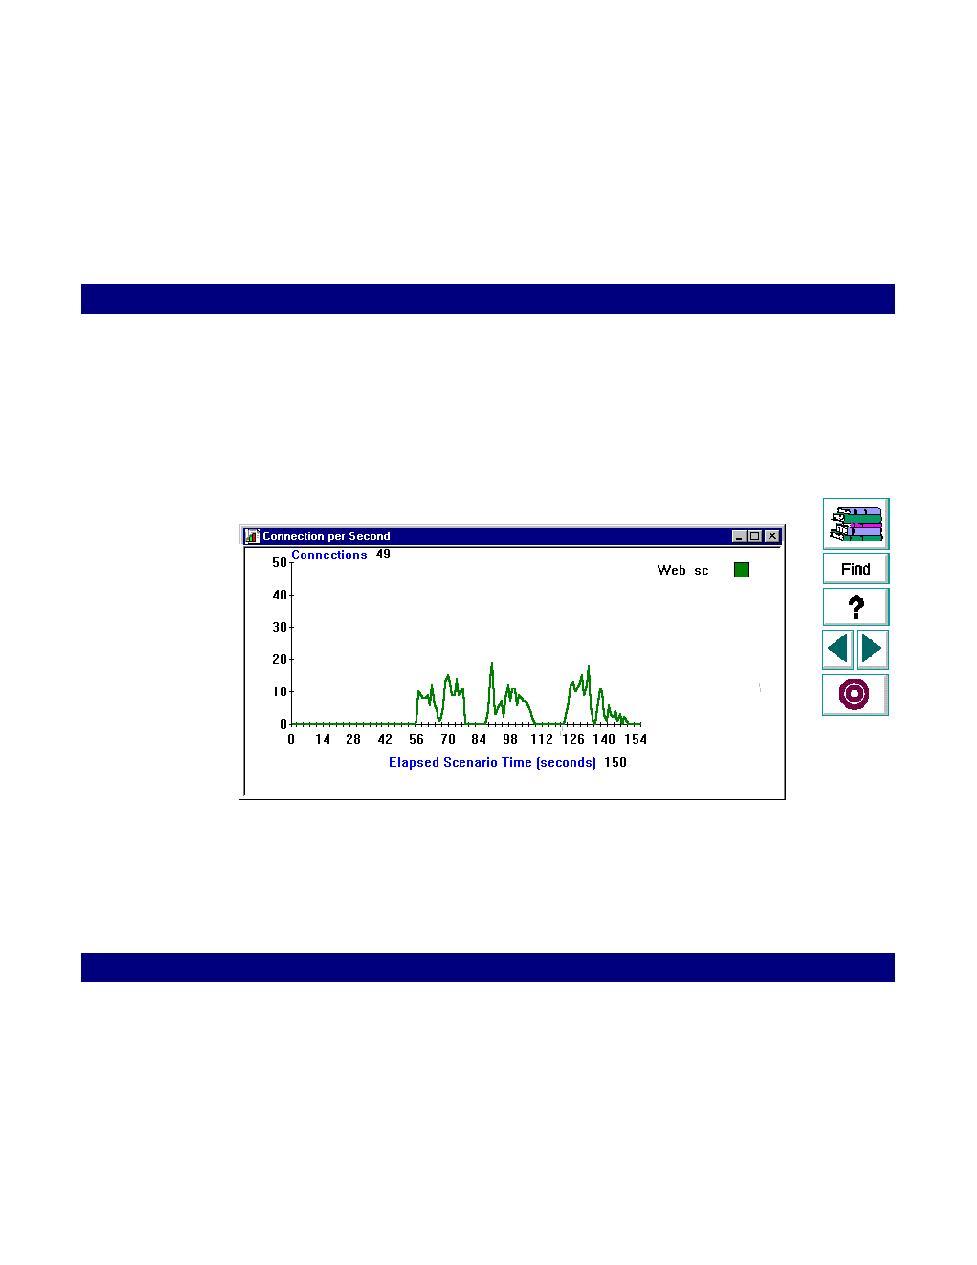
Connections per Second Graph
The Connections per Seconds graph shows the number of connections made to
the web server by Vusers during each second of the scenario run. This graph
helps you to evaluate the amount of load Vusers generate, in terms of the number
of connections. You can compare this graph to the Transaction Performance graph
to see how the number of connections affects transaction performance.
The
x-axis
represents the number of seconds elapsed since the start of the
scenario run. The
y-axis
represents the number of connections made to the server.
For example, the graph above shows how the number of connections decreased
gradually throughout the scenario. The largest number of connections per second
took place during the 90th second.