Throughput Graph
Analyzing Test Results · Web Vuser Graphs
LoadRunner Controller User's Guide (Windows)
Chapter 17, page 280
In
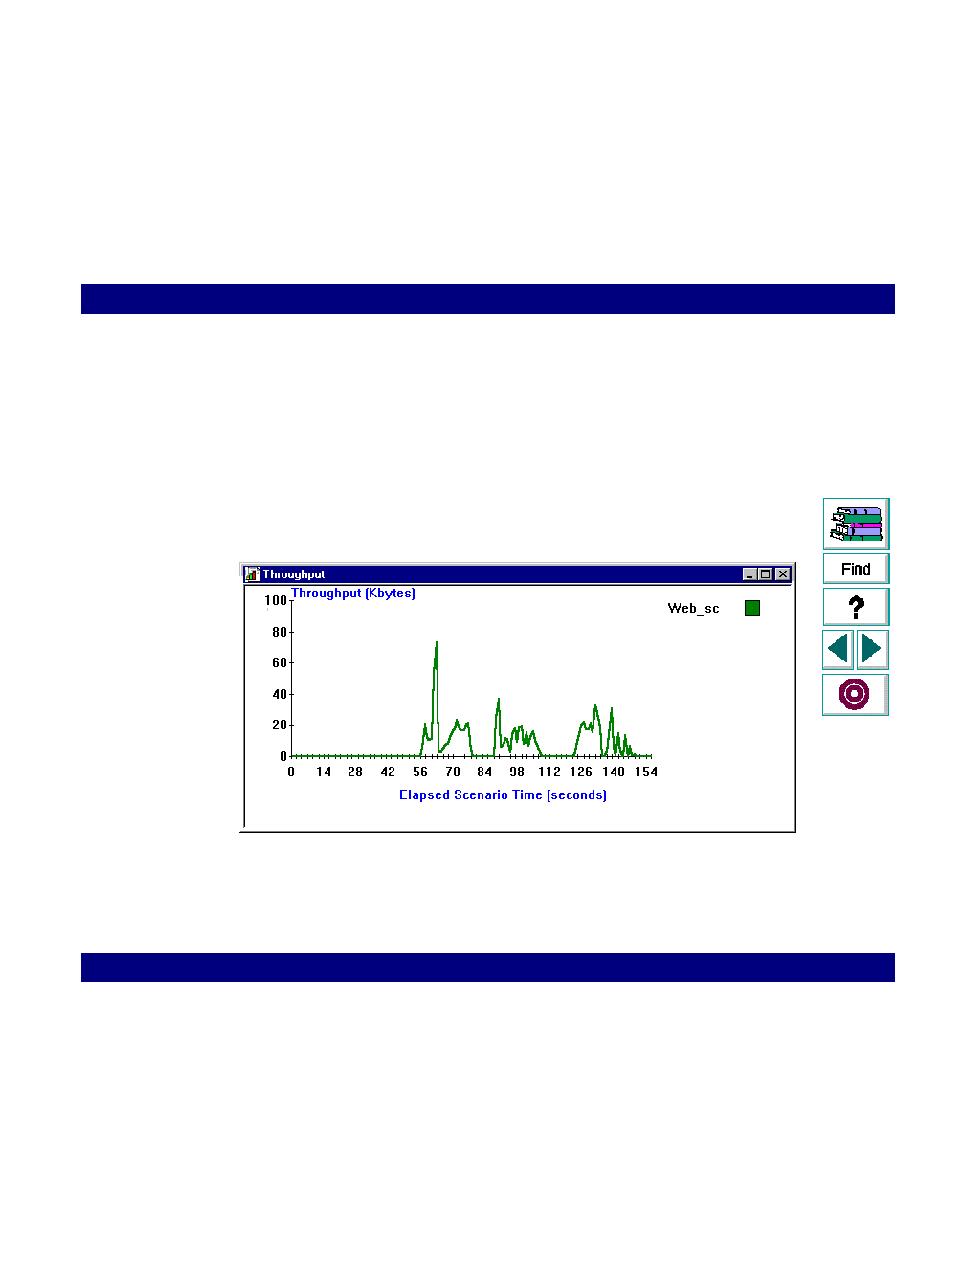
Throughput Graph
The Throughput graph shows the amount of throughput on the server during each
second of the scenario run. Throughput is measured in kilobytes and represents
the amount of data that the Vusers received from the server at any given second.
This graph helps you to evaluate the amount of load Vusers generate, in terms of
server throughput. You can compare this graph to the Transaction Performance
graph to see how the throughput affects transaction performance.
The
x-axis
represents the number of seconds elapsed since the start of the
scenario run. The
y-axis
represents the throughput of the server, in kilobytes. For
example, in the graph below, you can see that the highest throughput was about
75,000 bytes, during the 60th second of the scenario.